Job Agent Execution (Run) Timeline Report Graph in SSRS
Being able to holistically view your SQL Server Job Agent job schedules, how long each job took to run, what other jobs were running at the same time and the status of each job, should be a fundamental part of Job Agent management.
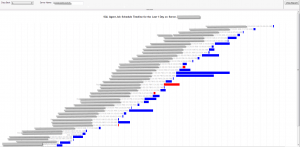
In this post I will be briefly introducing the current SSRS reports integrated into SSMS (or SQL Data Tools) that displays SQL Server Job Agent job information, as well as provide a new report (pictures above) that should give you a better holistic view of activities on your SQL Server Agent, as well as highlight any conflict in job schedules or times were no activity is occurring.
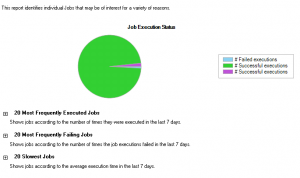
Currently SQL Server ships with 2 SSRS reports that displays some information about job run time and status, these reports can be reached via SSMS or Data Tools by pressing Right-Click on the SQL Server Agent node in Object Explorer and then clicking on Reports, were you will see two reports under Standard Reports:
- Job Steps Execution History: Shows historical performance of each job, along with execution duration and returned status.
- Top Jobs: Shows the top 20 most frequently executed, most frequently failing and slowest jobs. Handy for targeting the worst performing jobs
There is also the Job Activity Monitor Form: This is generally what most people use to monitor the activity on their SQL Server Agent instance, such as job failure, historical execution time, and many other textual data.
These reports are basic and provides a nice way to start investigating performance and execution problems within your Job Agent, but they are oriented around jobs, duration and execution statuses, rather than the visualization of temporal data in a way that we can detect jobs that are overlapping, the ones that are conflicting with each other, and generally the distribution of jobs over time to help you detect any periods of low activity and high activity on your Job Agent instance.
For that reason I created the SQL Job Agent Schedule Timeline SSRS report. This report (pictured at the top of the article) is essentially a Range Bar SSRS Chart that displays Time on its x-axis and jobs on the y-axis, ordered by the time when the execution started, the report takes the following parameters:
- Server Name: The name of the server were the Job Agent instance resides, in the format of [Server Name]\[Instance Name]
- Days Back: How many days should the report display. This parameter also determines the size of the report, which is dynamically increased if more days are displayed to accommodate for the increased number of jobs.
The SSRS report uses Job Agent System Tables to grab historical job run information, the query for which is embedded within the report itself (so no need to create a stored procedure on the server). The report is setup to run with the security context of the current Windows user, which needs to have rights to read from the Job Agent System Tables in msdb. Only jobs that took longer than 5 minutes to execute are displayed (limited by the query in the RDL), I only added that because otherwise the graph becomes very messy on my servers, this restriction can be removed by editing the query.
The report will display a job’s timeline in a blue bar if the job did not report a status 0 (or failure), and a red bar will be shown if the status is 0.
Although it is not really very much, it gives a very nice overview of how jobs are running on the current server, and helps you detect in a very visual way any issues that might rise due to schedule conflicts, high concentration of jobs at specific times of day, and time opportunities of low activities to move jobs into for a less resource intensive schedule.
Job Agent Execution (Run) Timeline Report Graph in SSRS rated 3 out of 5 by 4 readers


Thanks for sharing thought I would do the same. I ran into a snag with jobs that execute longer than 24hr. Some other changes to match my coding style.
err removed my link
code dump:
SELECT
name
— added Days Back to use a fitler aginst the user input
,DATEDIFF(DAY,CONVERT(DATE, calc.run_date),GETDATE()) AS DaysBack
,CONVERT( DATETIME, calc.run_date + SPACE(1) + calc.run_time) AS start_time
— using seconds here as I had a problem with times over 24 hrs
,DATEADD(SECOND, jh.run_duration, CONVERT( DATETIME, calc.run_date + SPACE(1) + calc.run_time)) AS end_time
,run_status
,instance_id
FROM msdb.dbo.sysjobhistory jh
INNER JOIN msdb.dbo.sysjobs j ON jh.job_id = j.job_id
— you where using TIME before so i’m assuming SQL 2008+
CROSS APPLY (
SELECT
— using brittle padding, we know the source is a number
— stuffing in symbols from back to front just a preference
STUFF(STUFF(REPLACE(STR(jh.run_date, 8), SPACE(1), ‘0’),7,0,’-‘),5,0,’-‘) AS run_date,
STUFF(STUFF(REPLACE(STR(jh.run_time,6),SPACE(1),’0′) ,5,0,':’),3,0,':’) AS run_time,
STUFF(STUFF(REPLACE(STR(jh.run_duration,6),SPACE(1),’0′),5,0,':’),3,0,':’) AS run_duration
) AS calc
WHERE
step_id = 0
— limit query to only last week and remove dynamic filter, I have a small setup
AND jh.run_date >= CONVERT(INT, FORMAT(DATEADD(DAY, -7, GETDATE()), ‘yyyyMMdd’, ‘en-GB’))
— just using a magic number here for simplicity, 05 minutes 00 seconds
AND jh.run_duration > 500
ORDER BY
start_time
Thanks for sharing
Hello,
is there a statement without the FORMAT-function, because in some sql server versions this functions can not be used.
greets
If yr running SQL 2000, you could use the CAST and CONVERT functions, maybe u need to do some string slicing as well to pad the year.