Text Classification Threshold Performance Graph
One way to increase the accuracy of a classification algorithm is to allow the algorithm to return an “Unknown” value, particularly when the probability of what we are trying to classify is too low to simply belong in one class and the algorithm is essentially guessing an answer, leading to incorrect classification.
In this post I will try and explore a method for researching and implementing the “Unknown” result in your classifier based on the probability distribution results of a classification, the idea is to give you the tools to tweak the optimum thresholds that gives you the best accuracy, while maintaining acceptable level of over-all coverage of data.
Of course the whole idea of introducing the “Unknown” result is to essentially try and reduce the number of incorrect classification by reporting them as unknown, or another way of saying it is that we want to report only on the instances were the algorithm is really sure about the top classification, on the assumption that this will be most likely a correct classification. Now the best way to investigate how sure the algorithm is about the returned classification is to look at the underlying probability of the returned top class.
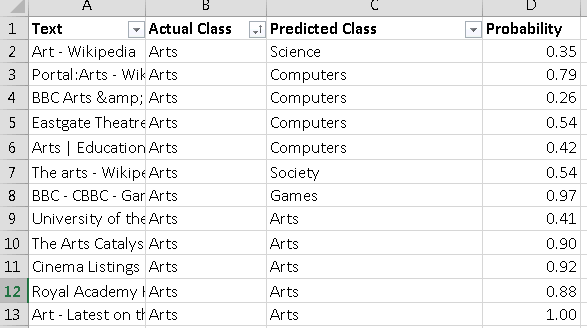
Lets take a real-life example. Below is a snippet from the results of a Topic classification algorithm, along with the probability of the returned predicted class.
Below we can see that for the Art class, we have the following statistics:
- Correct Classifications: 5
- Incorrect Classification: 7
- Classification Accuracy: 41%
Now the trick here is finding the correct threshold filter in the probability column, that gives us the best elimination of wrong guesses, while keeping a good coverage of correct guesses. For example if our threshold filter is 0.5, and any classification result probability that is below 0.5 we will return “Unknown” for instead, then we would have returned:
- Correct classifications: 4
- Incorrect Classification: 4
- Unknown (Unclassified): 4
- Classification Accuracy: 50%
- Classification Coverage: 66%
The best way to visualize this is to create a matrix of various probability filter threshold within your system, and test how the results look like after increasing the threshold at various steps, I have created the matrix below for one of the classification projects I worked on (so it is real-life data).
Coverage in the above matrix indicates the percentage of results we were able to classify (and did not return Unknown for), the equation for calculating it is simply: (Correct + Incorrect) / (Correct + Incorrect + Unknown)
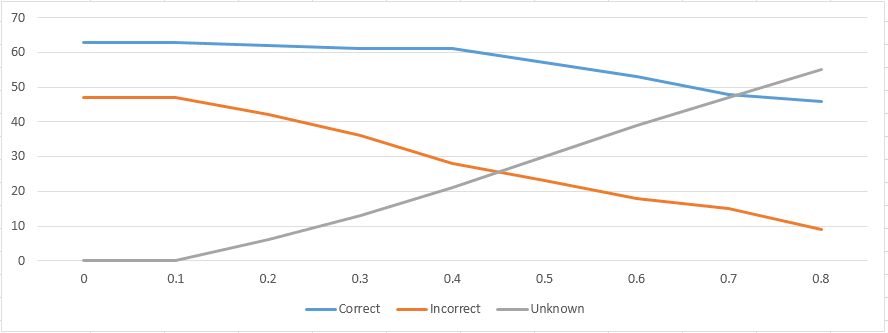
Based on the data above you could tweak the threshold to yield the most accurate result possible, while also maintaining an acceptable coverage rate, of course each classification problem might have a different optimum threshold, and the better the algorithm is, the more coverage you will keep, and less correct results you will drop (increase effective accuracy) in comparison to incorrect results.
You could also visualize this using a line graph, which is a neat way to see how the drop-off is between the correct and incorrect lines.
You could extend this solution and assign different threshold based on the classification results, for example you could say that if the returned classification is Art then our threshold is 0.5, but if the returned classification is Business then our threshold should be 0.6 instead, because we know that our Business classification returns a higher level of False Positives (low precision). If you are attempting variable threshold like that I recommend reading the article on the confusion matrix and precision in classification.


Trackbacks & Pingbacks
[…] If your model can tolerate a reduction in the coverage of what it can classify, you could greatly improve the accuracy of what is being classified by returning “Class Unknown” when the classifier is too uncertain (highest probability is lower than threshold), this can be done by analyzing probability filter threshold against accuracy and coverage. […]
Leave a Reply
Want to join the discussion?Feel free to contribute!